
While the flows of Nordic-Baltic migration might be small compared to the rest of the movements within Europe, they have an important role to play in the development of the region and relationships between countries. New trends and implications for the region were discussed at a recent conference in Tallinn called “Migration and Demographic Challenges in the Nordic-Baltic region”, organised by the Nordic Council of Ministers’ Office in Estonia.
Nordic countries usually, and in the context of the council, denote Iceland, Norway, Denmark, Sweden and Finland. Baltic countries consist of Estonia, Latvia and Lithuania. This conference focused mostly on Norway, Sweden and Finland, but included comparisons with Poland, as Poles make up usually larger migrant flows than the populations from the neighbouring Baltic States. For example, Per Lundborg from Stockholm University showed a graph (see below) of Baltic and Polish migrants coming to Sweden between 2000-2011 with the Poles outnumbering the rest, and their inflows peaking in 2006-2008 at around 6,000-7,000 immigrants per year. Around 1,000 Lithuanians arrived to Sweden per year between 2009-2011. Latvians’ numbers increased since 2009, but still remained below 1,000 per year, and Estonians’ inflow was the smallest, with relatively little change since 2000.
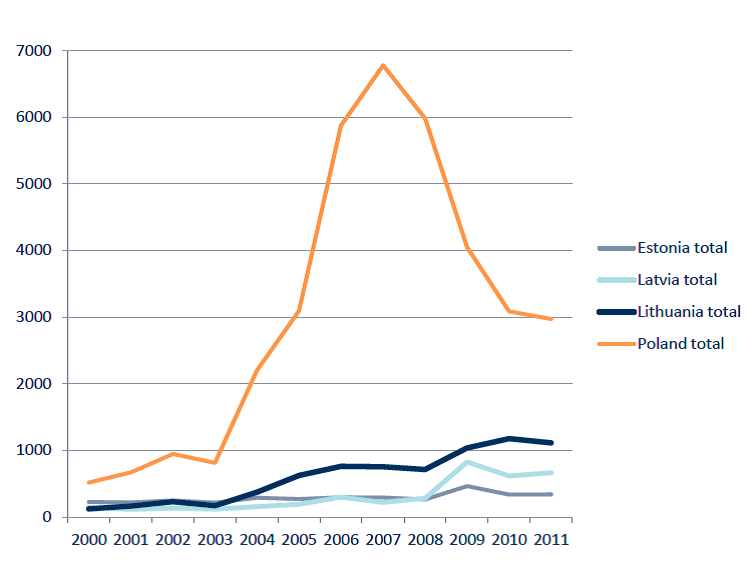
Number of Baltic and Polish Migrants in Sweden 2000-2011. Source: Per Lundborg 2013
Destinations and Characteristics of Migrants
Different inflows to Nordic countries reflect origin country population sizes, but also different destination patterns. Estonians often choose Finland due to its geographic and cultural closeness (with only 80 km between Tallinn and Helsinki, and the languages belonging to the same language group makes it easier to move there as well as understand the society compared to other places). Based on Jon Horgen Friberg’s presentation, it can be seen that Lithuanians and Latvians have more often chosen Norway, Denmark and Sweden as their destination countries in the Nordic region. Despite Poles making up larger migrant communities in terms of absolute numbers, Lithuanians are leading in terms of the crude rate of net migration in Europe – 23,7 Lithuanians per 1000 people emigrated from the country in 2010, according to Dovilė Krupickaitė of Vilnius University. Lithuanian emigration peaked in 2010, and Latvia’s in 2011 (for Latvian figures see Elina Apsite-Berina’s slides), reflecting employment difficulties due to economic recession. The representative of the Lithuanian state, Andrius Tekorius, mentioned that partly the large Lithuanian emigration numbers in 2010 can be explained by a certain tax legislative amendment implemented that year which resulted in people registering their place of residence outside of Lithuania (even though migration might have happened much earlier).
There have been a total of around 200,000 people emigrating from Estonia to different destination countries in 1991-2011, according to Tiit Tammaru, a professor at Tartu University. However, to a large extent these have been non-Estonians, especially Russians, Belarusians and Ukrainians, many of whom returned to their home countries in the 1990s. Similar ethnic-specific out-migration could be observed in Lithuania in the first half of the 1990s when 93% of the emigrants from Lithuania were non-Lithuanians, according to Dovilė Krupickaitė. Even after considering the migration of those who went back to their families and relatives in the 1990s, ethnic-specific out-migration also at later years refers to these groups being more prone to migrate than others. Tiit Tammaru also suggested that emigration from Estonia has become more pronounced among lower educated groups since the EU enlargement in 2004, thus not supporting the brain drain hypothesis, (at least for Estonia). Also he made an interesting comparison between Estonia and other European regions (see figure below) which shows opposing trends of net migration. Estonia and Eastern Europe had a positive net migration up to 1990, while West-, North- and South European countries had a negative net migration up to 1990. Since then the net migration curves have diverged in opposite directions, reflecting the fall of the Iron curtain.

Net Migration in Europe 1960-2011. Source: Estonian Human Development Report 2013
In general, it is still mostly young people in their twenties and thirties who are most active migrants, proving that the Andrei Rogers’ migration age-curve holds true also for the current Nordic-Baltic migration flows. There are increasingly more migrants who are moving with a partner or living with a partner in the destination countries, thus referring to them settling in and having plans for a longer-term stay, according to Jon Horgen Friberg. Greater number of female Baltic migrants in Sweden and Finland are indicative of family-(re)unification (but probably also of female labour migration), especially for Estonians in Sweden, according to Per Lundborg.
Coping and Return Migration
Much of the migration is still labour-oriented, especially in the context of the recent recession and wage differences between Nordic and Baltic countries. In Norway, migrants are mostly employed in manufacturing, construction and temporary staffing sectors, which are areas with high unemployment risks. In Sweden, Baltic migrants have mostly settled in financial business and services (19% of Estonian migrants, 21% of Latvians and 17% of Lithuanians), health care (19% of Estonians, 15% of Latvians, 12% of Lithuanians) and trade and communication (17% of Estonians, 14% of Latvians, 12% of Lithuanians). Construction sector has been the largest employer for Lithuanians with 18% of them working in that area. Estonians in Finland are spread more evenly across different sectors. According to Jan Horgen Friberg, migrants from the EU10 (countries that joined the EU in 2004) have found niche areas in the Norwegian labour market, coping and keeping their jobs even without knowing the local language, thus performing better than some other migrant groups in the country. Arguably, this indicates to existing migrant networks in the destination countries that help the newcomers to find work in sectors where acquiring the local language is not necessary, but also meaning that the migrants and their employers speak similar languages. In Sweden, the working hours and wages do not differ much between the Baltic migrant groups and the Swedes, according to Per Lundborg. Also, Estonians cope well on the Finnish labour market, with their unemployment being lower now than ever before in Finland, according to Elli Heikkilä.
In the Finnish case, there are approximately 25,000-30,000 regular commuting Estonians which distinguishes Estonian-Finnish migration slightly from the rest of the region’s flows. In any case, Baltic migrants indicate a relatively high return migration, and not just from the Nordic countries. For example, 70% of the inward migrants in 1991-2010 to Lithuania comprised of Lithuanians, according to Dovilė Krupickaitė. Similarly, Estonians (together with Irish and Slovaks) are leaders within Europe in terms of the proportion of the population having the experience of living and working abroad, according to Tiit Tammaru.
The conference was held in English. In case of interest, all presentations are available here.

what are the units in the 2nd pic?
Hi, the second graph should reflect the net migration rate or difference between incoming and outgoing migrants per 1,000 inhabitants.
Thank you, Lilli